Due to construction, we will not be conducting a rain barrel sales event in 2024. Please check back in 2025.
2015 Annual Water Quality Report
04.27.2015
Portland Water District
Published May 2015
1/ 1/14 – 12/31/14
PWSID: ME 0091300 and ME 0091302 ![]()
The Source: Where does your water come from?
Ensuring Water Quality: Water Purification and Disinfection
Challenges: Aging Infrastructure
Water Quality Analysis
Water Safety and Advice: Ask the water expert about discolored water
Health Advisories
Steep Falls Supplemental Information
It’s simple, everyone needs water. Getting it to you, not so simple. It takes a vast network of resources – from our protected water source to over 1,000 miles of pipe - to deliver water to your tap. In addition, we employ dual disinfection processes and constantly monitor water quality to ensure safe, clean water is available to you. An added challenge is aging infrastructure. Roughly 20% of Greater Portland’s water distribution system is over 80 years old—which demands increasing investments every year to ensure fresh, clean water keeps flowing from the tap.
In this water quality report, you will find a wealth of information on the complex system that churns 24 hours a day, 7 days a week, to ensure the water is there when you turn on the tap.
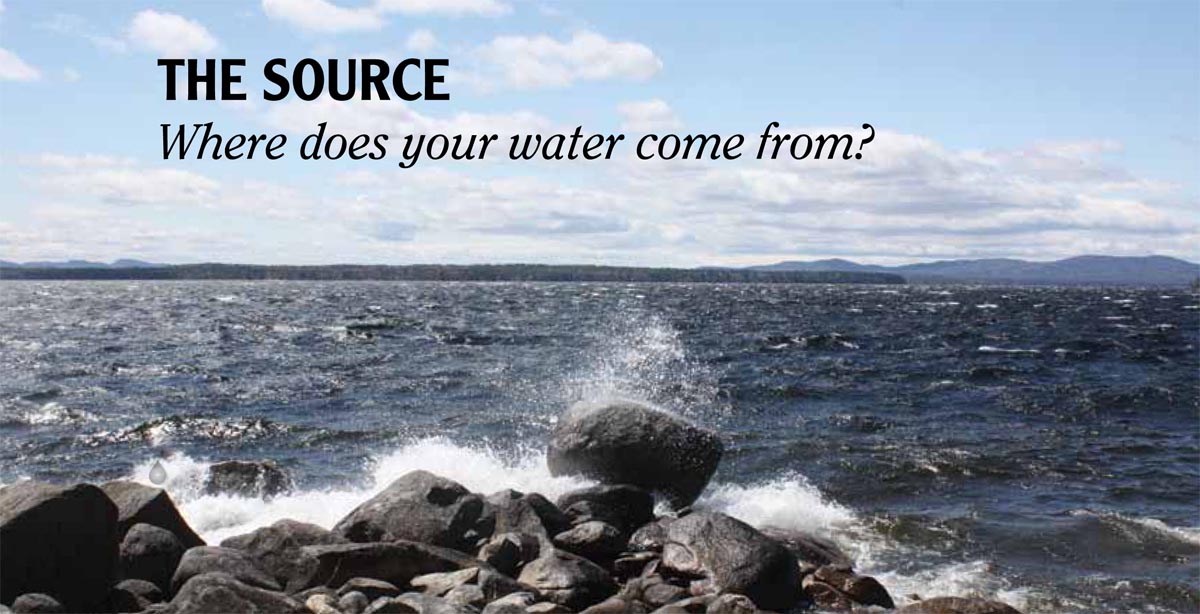 Your drinking water comes from Sebago Lake, Maine’s deepest and second largest lake. By almost any measure, the quality of water in Sebago Lake is among the highest of any lake in Maine. It is so clean, in fact, it is exempt from filtration requirements.
The lake is so clean for three main reasons:
1. It is naturally deep and cold, and the soil around the lake doesn’t easily erode;
2. People have cared for it so well for more than a century and continue to do so; and
3. The land around the lake – known as the watershed – is mostly covered with forest. Forested land naturally cleans the water as it makes its way to the lake.
Keeping the lake clean is the best way to ensure clean, safe drinking water for decades to come.
Moderate Risk of Contamination
Although Sebago Lake is very clean today, human activities on and around the lake can pose a risk to water quality.
The Maine Drinking Water Program has evaluated all public water supplies as part of their Source Water Assessment Program (SWAP). The assessments reviewed geology, hydrology, land uses, water testing information, and the extent of land ownership or protection by local ordinance to see how likely drinking water sources are to being contaminated by human activities in the future. Their report on Sebago Lake concludes that the lake is at moderate risk of contamination.
The most significant risks to the long-term protection of Sebago Lake, according to state officials, are boating and ice fishing in Lower Bay and shoreland development. For more information about the SWAP, please contact the DWP at 287-2070.
Lowering Risk of Contamination
Because the lake is used by so many for various reasons, our efforts to decrease the risk of contamination involve multiple approaches. Our protection program involves: water quality monitoring, security, inspections, direct actions, education, land acquisition, and land preservation.
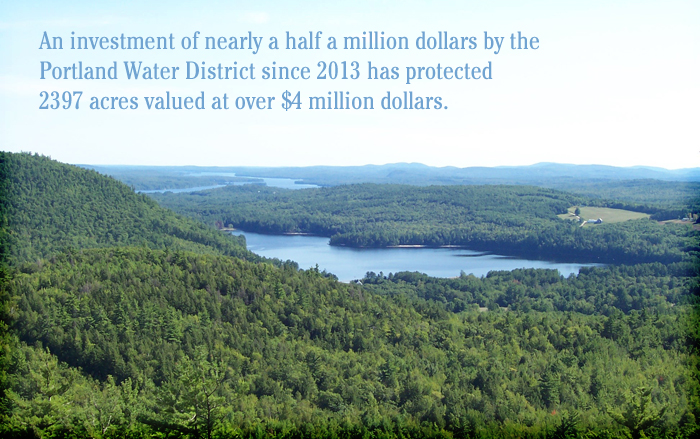
Keeping the land surrounding the lake forested is key to protecting the water quality of the lake since forests naturally clean water. To help make this happen the Board of Trustees approved an initiative in 2013 to help local land trusts and willing landowners conserve forested land. The District will contribute up to 25% of the cost of these transactions since our customers directly benefit with cleaner water. When a willing landowner and land trust apply for financial support, we evaluate the property to determine its value to the overall protection of the lake and choose a level of support accordingly.
Conserving forested land helps keep the water in Sebago Lake clean—directly impacting the quality of water delivered to customers. If lake water quality were to decline significantly, the District would have to add additional treatment to meet drinking water standards. The cost of this would be much greater than the cost of maintaining forested land through conservation.
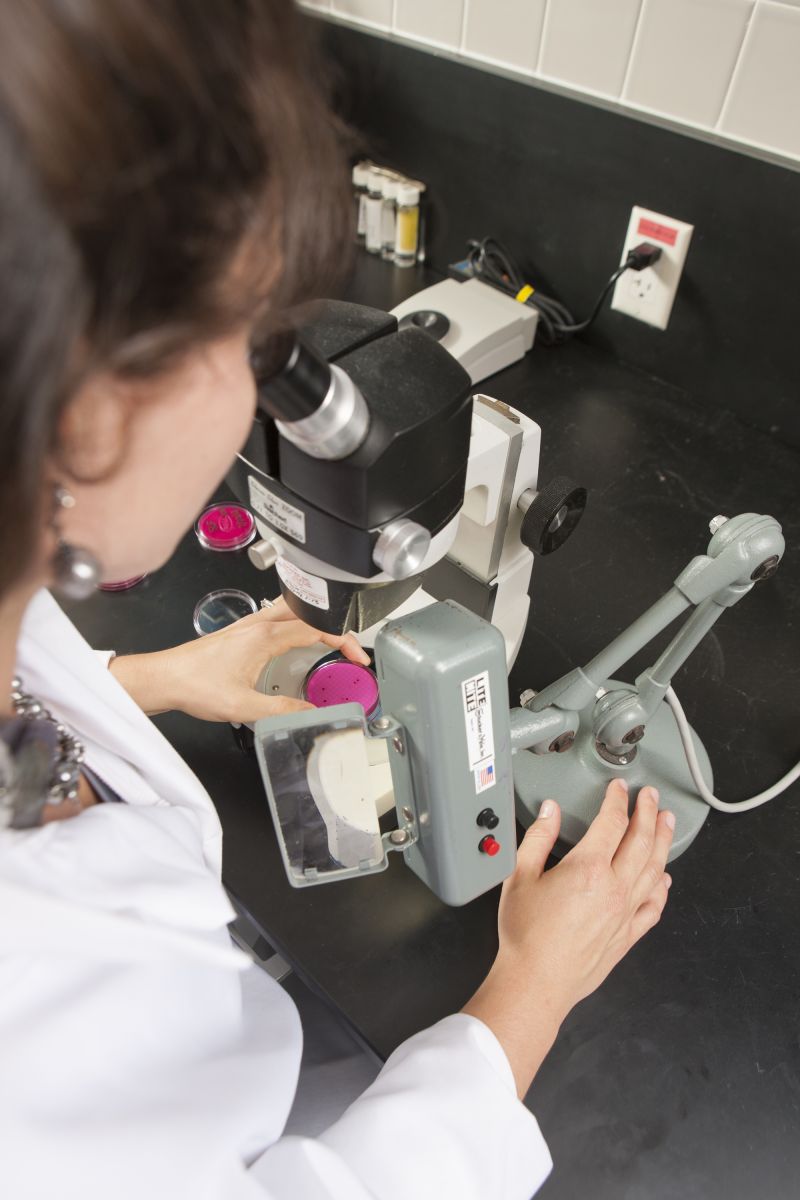
Ensuring Water Quality: Water Purification and Disinfection
Meeting your expectations for high quality water is our first priority. We know your water is safe because we regularly monitor and test it. Our water quality experts performed over 15,000 analyses last year. Many inorganic, synthetic organic and volatile organic chemicals, and disinfection by-products are routinely monitored for and not detected.
- Primary disinfection: ozone and ultraviolet light
- Secondary disinfection: chloramine
- Filtration: None, PWD holds a waiver from filtration due to the purity of Sebago Lake.
- pH adjustment: sodium hydroxide
- Corrosion control: zinc orthophosphate
- Dental health additive: fluoride (hydrofluorosilicic acid)
In 2014, your water met or surpassed every state and federal requirement. Water samples are tested by state-certified testing laboratories including the Portland Water District laboratory which is certified by the Maine Department of Health and Human Services.
Aging Infrastructure
With nearly 1,000 miles of pipe serving our 11 communities, we are focused on getting safe, clean, great tasting water to you when and where you need it. That takes forward thinking and investment.
The Problem
It is a problem water utilities face nationwide - the aging of buried infrastructure. Because much of the water system was built in the late 19th and early 20th century, those pipes have reached the end of their useful life. Twenty percent of Greater Portland's water system is over 80 years old.
The Solution
To avoid increases in water service disruptions and water quality issues, the Portland Water District has slowly increased its investments in water main replacement, from $2.5 million in 2011 to $6.5 million in 2015. Over the last 5 years, the Portland Water District has invested $22 million in water main replacements while striving to keep water rates affordable.
Water Main Replacement Program
The age of the pipe isn't the only thing that contributes to water main failures. The Portland Water District has a comprehensive water main replacement program that considers age, type of material, and leak history. Planning also takes into consideration water quality issues, local impacts, and efficiencies realized through the integration with other infrastructure projects.
Success
Our investments are working! Water main leaks have been reduced since 1985. In fact, in 2014, we had roughly 9 main breaks per 100 miles of pipe compared to the national standard of 25-30 breaks per 100 miles of pipe.
Distribution System: Just the size of it

Miles of pipe – 1,000
Materials – Mostly Cast Iron and Ductile Iron
Age of Pipe :1870 – 2014
Leak Frequency – 9 breaks per 100 miles of pipe, compared to the national standard of 25-30 breaks per 100 miles of pipe a year
Water Quality Analysis
Detected Regulated Substances
| Substance | Violation | Ideal Goal MCLG | Highest Level Allowed MCL |
Amount Detected in 2014 (unless otherwise noted) | Source | ||
| Microbiological | |||||||
| Total coliform bacteria1 | No | 0% of monthly samples | No more than 5% of monthly samples | Highest % detected: 0.76% in November Monthly Range: 0.0% - 0.76% | Naturally present in environment | ||
| Inorganic Chemicals | |||||||
| Barium (mg/L) | No | 2 | 2 | 0.003 | Erosion of natural deposits | ||
| Copper (mg/L)2 | No | 1.3 | AL = 1.3 | 0.45 | Corrosion of household plumbing systems; erosion of natural deposits | ||
| Lead (µg/L)3 | No | 0 | AL=15 | 5 | Erosion of household plumbing systems | ||
| Fluoride (mg/L) | No | 4 | 4 | Average: 0.70; Range: 0.51 - 0.93 | Water additive which promotes strong teeth; erosion of natural deposits | ||
| Chloramine(mg/L) | No | MRDLG=4 | MRDL=4 | Average:2.02 Range: 0.20 - 2.37 | A water additive used to control microbes | ||
| Turbidity(NTU) | No | None | 5 | Average: 0.23; Range: 0.14 - 0.68 | Soil runoff | ||
| Organic Compounds | |||||||
| Total Haloacetic Acids, HAA (µg/L) | No | 0 | 60 | LRAA:<8.0; Range: <8.0 - 11 | By-product of drinking water chlorination | ||
Footnotes:
1 Annual detection - 1 in 1910 samples ; monthly detection - November 1 in 132 samples or 0.76%
2 None of the 50 homes tested in 2014 exceeded the action level for copper.
3 1 of the 50 homes tested in 2014 exceeded the action level for lead.
Mineral Content and Secondary Standards
| Substance | Maine Recommended Limit | Result | Likely Source |
| Chloride(mg/L) | 250 | 10 | Natural mineral, road salt |
| Color(PCU) | 15 | <10 | Natural characteristic |
| Hardness(mg/L as CaCO3) | 150 | <10 | Natural mineral |
| Iron(mg/L) | 0.3 | <0.01 | Natural mineral |
| Manganese(mg/L) | 0.05 | <0.03 | Natural mineral |
| Sodium(mg/L) | 100 | 5.6 | Natural mineral, road salt |
| Sulfate(mg/L) | 250 | 5.4 | Naturally occuring |
| Magnesium(mg/L) | 50 | 0.5 | Natural mineral |
| Calcium(mg/L) | 500 | 2.6 | Natural mineral |
| Zinc(mg/L) | 5 | 0.10 | Natural mineral, corrosion control additive |
Detected Unregulated Substances
Ongoing Research For New Regulations
| Substance | Violation | Health Advisory, µg/L | Range of Results,Detected in year noted) | Source |
| Nitrosamine - NDEA; N-nitrosodiethylamine, µg/L (2010) | No | No EPA health data | Average:0.0533, Range: 0.0066-0.1 | By-product of drinking water chloramination |
| Chlorate,µg/L(2013) | No | No EPA health data | Average:90 Range: 64-140 | Agricultural defoliant or desiccant; used in the production of chlorine dioxide |
| Chromium, Total, µg/L(2013) | No | No EPA health data | Average:0.29 Range: 0.27-0.31 | Erosion of natural deposits |
| Hexavalent Chromium,Dissolved, µg/L(2013) | No | No EPA health data | Average:0.057 Range: 0.037 - 0.110 | Naturally occurring element; used in making steel and other alloys |
| Strontium,µg/L(2013) | No | No EPA health data | Average:21 Range: 20-23 | Erosion of natural deposits |
Unregulated Substances are those that don't yet have a drinking water standard set by the USEPA. The purpose of monitoring for these contaminants is to help EPA decide whether or not they should have a standard.
As part of this 2013 monitoring, the Portland Water District tested for several additional unregulated contaminants, all without detection. This included hormones such as testosterone and estradiol that are produced in the human body and used in pharmaceuticals.
MCL: Maximum Contaminant Level. The highest level of a contaminant that is allowed in drinking water.
MCLG: Maximum Contaminant Level Goal. The level of a contaminant in drinking water below which there is no known or expected risk to health.
MRDL: Maximum Residual Disinfectant Level. The highest level of a disinfectant allowed in drinking water.
MRDLG: Maximum Residual Disinfection Level Goal. The level of a drinking water disinfectant below which there is no known or expected risk to health. MRDLGs do not reflect the benefits of the use of disinfectants to control microbial contaminants.
LRAA: Locational Running Annual Average. An annual average calculated at each monitoring site.
Variances and Exemptions: State permission not to meet MCL or a treatment technique under certain conditions.
AL = Action Level: The concentration of a contaminant that, if exceeded, triggers treatment or other requirements that a water system must follow. Action Levels for Lead and Copper are measured at the tap of “high risk” homes. Ninety percent of tests must be equal to or below the Action Level.
ppb: one part per billion.
ppm: one part per million.
mg/L: milligrams per liter, or parts per million.
µg/L: micrograms per liter, or parts per billion
Turbidity: The measurement of cloudiness or suspended colloidal matter (silt). As you can see from the table, all of the samples taken of our water system were well below 5 NTUs.
NTU=Nephelometric Turbidity Units
Notes:
Fluoride: Fluoride levels must be maintained between 0.5 to 1.2 ppm. The optimum level is 0.7 ppm.
Lead/Copper: Action levels (AL) are measured at consumer’s tap. 90% of the tests must be equal to or below the action level. If present, elevated levels of lead can cause serious health problems, especially for pregnant women and young children. Lead in drinking water is primarily from materials and components associated with service lines and home plumbing. Portland Water District is responsible for providing high quality drinking water, but cannot control the variety of materials used in plumbing components. When your water has been sitting for several hours, you can minimize the potential for lead exposure by flushing your tap for 30 seconds to 2 minutes before using water for drinking or cooking. If you are concerned about lead in your water, you may wish to have your water tested. Information on lead in drinking water, testing methods, and steps you can take to minimize exposure is available from the Safe Drinking Water Hotline or at: http://www.epa.gov/safewater/lead
TTHM/HAA5: Total Trihalomethanes and Haloacetic Acids (TTHM and HAA5) are formed as a by-product of drinking water chlorination. This chemical reaction occurs when chlorine combines with naturally occurring organic matter in water. Compliance is based on locational running annual average.
About the Regulations
The federal Safe Drinking Water Act directs the state, along with the EPA, to establish and enforce drinking water standards. The standards set limits on certain biological, radioactive, organic and inorganic substances sometimes found in drinking water. Two types of standards have been established. Primary drinking water standards set achievable levels of drinking water quality to protect your health. Secondary drinking water standards provide guidelines regarding the taste, odor, color, and other aesthetic aspects of your drinking water, which do not present a health risk.
Health Advisories
Drinking water, including bottled water, may reasonably be expected to contain impurities or contaminants. However, these contaminants do not necessarily indicate that water poses a health risk. Microbial contaminants, such as viruses and bacteria, which may come from sewage treatment plants, septic systems, agricultural livestock operations, and wildlife. Inorganic contaminants, such as salts and metals, which can be naturally occurring or result from urban stormwater runoff, industrial or domestic wastewater discharges, oil and gas production, mining, or farming. Pesticides and herbicides, which may come from a variety of sources such as agriculture, urban stormwater runoff, and residential uses. Organic chemical contaminants, including synthetic and volatile organic chemicals, which are by-products of industrial processes and petroleum production and can also come from gas stations, urban runoff, and septic systems. Radioactive Contaminants, which can be naturally-occurring or be the result of oil and gas production and mining activities.
Some people may be more vulnerable to contaminants in drinking water than the general population. Immunocompromised people such as individuals with cancer undergoing chemotherapy, people who have undergone organ transplants, people with HIV/AIDS or other immune system disorders, some elderly, and infants can be particularly at risk from infections. These people should seek advice about drinking water from their health care providers. Guidelines, jointly developed by the EPA and the CDC, on the appropriate means to lessen the risk of infection by Cryptosporidium, are available from the Safe Drinking Water Hotline or web site.
 Water Safety and Advice
Ask the Water Expert
Inquiries about dirty water are some of the most common customer calls we receive, and for good reason. It’s disconcerting when you turn on the tap expecting clear water and instead see water that is discolored or dirty. Customers often wonder why this happens, what they can do, and most of all, if the water is still safe to use? Read on for answers to these and other questions about dirty water.
Why does my water look dirty? Dirty or discolored water is often due to a disruption in the water main. When water flows through the pipes faster than normal, natural sediment at the bottom of the pipe can get stirred up. This can happen as a result of a water main break, higher water flow due to firefighting, or even a street sweeper using a hydrant to fill up its tanks. Sometimes PWD turns valves or flushes water mains and this can stir up the sediment as well.
My hot water is dirty but the cold water still looks fine. What does that mean? Sometimes the culprit of dirty water is your hot water heater. If the problem is in the hot water only, it’s probably a sign that the hot water heater needs to be flushed or drained, or maybe even replaced. You can contact your plumber to evaluate your hot water heater.
Is my water still safe to drink? The sediment that is stirred up is inert, so it is not harmful and your water is still safe to drink.
What can I do? Normally, discolored water will clear up on its own. If it doesn’t, we recommend that you flush the pipes in your house after the main disruption event is over. This will clear out any remaining sediment or discolored water. One good way to do this is to fill and drain your bathtub once or twice. If you’re still having problems with dirty water, or if you have dirty water that persists for several days or goes away and then returns, please give us a call. We can help diagnose and solve the problem.
More Information
The Portland Water District Board of Trustees generally meet every second and fourth Tuesday of the month. The public is welcome to attend meetings.
207.761.8310 (Monday through Friday between 8:00 a.m. and 4:30 p.m.)
Portland Water District
225 Douglass Street
PO Box 3553
Portland, Maine 04102
www.pwd.org
Customerservice@pwd.org
www.twitter.com/MyPortlandWater
www.facebook.com/MyPortlandWater
Environmental Protection Agency
800.426.4791 * www.epa.gov/safewater/
American Water Works Association
303.794.7711 * www.awwa.org
Maine Drinking Water Program
207.287.2070 * www.maine.gov
National Centers for Disease Control
404.639.3311 * www.cdc.gov
Steep Falls, Standish Supplemental Information
Because the Steep Falls water system is separate from the Greater Portland water system, some components of the Water Quality Report do not apply to your system. Those sections have been modified and provided below.
Your Source of Water and Ensuring Water Quality
The Steep Falls well system (Standish) supplies approximately 300 people. Treatment includes the addition of liquid sodium hypochlorite for disinfection, sodium hydroxide for pH adjustment and corrosion control, aeration for radon removal, and fluoride (sodium fluoride).
The state Drinking Water Program waived the requirement to sample for pesticide, herbicide, carbamate and PCB in the Steep Falls water system through 2016. The waiver was granted based on past water test results and the land uses in the proximity of the wells. Other testing for inorganic and volatile organic compounds continues at the required frequency.
Detected Regulated Substances
|
Substance |
MCLG |
MCL |
Amount Detected in 2014 (unless otherwise noted) |
Violation |
Source |
|
Radionuclides |
|
|
|
|
|
|
Gross alpha (pCi/L) 2012 |
0 |
15 |
7.6 ± 4.6 |
No |
Erosion of natural deposits |
|
Radium, Combined (pCi/L) 2012 |
0 |
5 |
1.2 |
No |
Erosion of natural deposits |
|
Radium-226 (pCi/L) 2012 |
0 |
5 |
0.4 ± 0.17 |
No |
Erosion of natural deposits |
|
Radium-228 (pCi/L) |
0 |
5 |
0.8 ± 0.5 |
No |
Erosion of natural deposits |
|
Radon (pCi/L) |
4000 |
4000 |
1040 |
No |
Erosion of natural deposits |
|
Organic Compounds |
|
|
|
|
|
|
Total Trihalomethanes (mg/L) 2013 |
0 |
80 |
6.30 |
No |
By-product of chlorination |
|
Inorganic Chemicals |
|
|
|
|
|
|
Barium (mg/L) |
2 |
2 |
0.007 |
No |
Erosion of natural deposits; discharge of drilling waste and metal refineries |
|
Chromium (mg/L) |
100 |
100 |
1 |
No |
Erosion of natural deposits; discharge from steel and pulp mills |
|
Uranium (mg/L) |
0 |
30 |
4 |
No |
Erosion of natural deposits |
|
Chlorine (mg/L) |
MRDL=4 |
MRDL=4 |
1.00 |
No |
A water additive used to control microbes |
|
Fluoride (mg/L) |
4 |
4 |
0.72 |
No |
Water additive which promotes strong teeth |
|
Copper (mg/L)1 2012 |
AL=1.3 |
AL=1.3 |
0.06 |
No |
Corrosion of household plumbing systems |
|
Nitrate - Nitrogen (mg/L) |
10 |
10 |
1.1 |
No |
Fertilizer runoff; leaching septic tanks; erosion of natural deposits |
1None of the 5 homes tested in 2012 exceeded the action limit for copper.
Definitions
Other definitions
pCi/L: picocuries per liter (a measure of radioactivity)
Notes
Gross Alpha: Action level over 5 pCi/L requires testing for Radium 226 and 228. Action level over 15 pCi/L requires testing for Uranium. Compliance is based on Gross Alpha results minus Uranium results = Net Gross Alpha.
Radon: The State of Maine adopted a Maximum Exposure Guideline (MEG) for Radon in drinking water at 4000 pCi/L, effective 1/1/07. If Radon exceeds the MEG in water, treatment is recommended. It is also advisable to test indoor air for Radon. Radon at a level of 1040 pCi/L was detected in Steep Falls’ well water after aeration treatment. Radon is found in the soil and bedrock formations and is a water soluble, gaseous by-product of uranium. Most radon is released to the air moments after turning on the tap. Only about 1-2 percent of radon in the air comes from drinking water. Inhalation of radon increases the risk of lung cancer over the course of your lifetime.If you’d like more information about radon, please contact us or the State Drinking Water Program and request a radon fact sheet. Nitrate: Nitrate in drinking water at levels above 10 ppm is a health risk for infants of less than six months of age. High nitrate levels in drinking water can cause blue baby syndrome. Nitrate levels may rise quickly for short periods of time because of rainfall or agricultural activity. If you are caring for an infant you should ask advice from your health provider.
